2003 Cedar Fire Case Study
Statement of Problem
What environmental factors contribute to the recovery of a burn area? This study will provide insight to areas that are impacted by large fires of what steps to take to ensure that burn areas successfully recover by analyzing the topography and precipitation of the Cedar Fire’s burn area. With California being known for its mountains, how does topography affect post-fire recovery? Being a state that is dominated by deserts and receives low rainfall, how does precipitation affect post-fire recovery? Identifying factors that expedite recovery or that hinders it will give areas impacted by fires the foresight to predict what problems their burn site will face.
Purpose of Research
With an increase in the severity and frequency of wildfires in California, understanding post-fire recovery and regeneration has become a pressing matter. This research will inform local and state governments of what areas will struggle or succeed to recover quickly post-fire. Identifying environmental characteristics that contribute to a slow recovery will allow officials to make fire mitigation decisions focusing on these areas. Officials will also use this information to make decisions regarding recovery and resources for these areas.
Literature Review
Landsat raster data has a 30-meter spatial resolution and a spectral resolution determined to be suitable to analyze burn severity over a large burn area by Cardil et al (2019). Peterson and Stow used Landsat data to analyze chaparral post-fire regrowth in the years 1990, 1996, and 1998, but they noted that their study could have been improved by including data from other years (2003). This project uses Landsat data collected in the years 2003, 2005, 2007, 2009, 2011, 2013, 2015, 2017, and 2019 to gain a well-rounded understanding of post-fire regeneration found in the large burn area of the Cedar Fire.
Rogan et al provides a methodology for preprocessing Landsat 5 Thematic Mapper (TM) and Landsat 8 Operational Land Imager (OLI) and Thermal Infrared Sensor (TIRS) raster data to analyze changes in vegetation coverage (2009). Dark Object Subtraction (DOS) atmospheric correction reduced the haze in the raster bands by assuming that the pixel with the lowest value to be black and subtracts that value the rest of the pixels in the band.
Lui et al tests novel band ratios to fine-tune burn change detection for Landsat data (2019). The authors explain that NBR has “proved useful in extracting burned areas and it is accepted as the standard spectral index for fire severity assessment” and based one of their own experimental band ratios off of it (Lui et al, 2019). This project uses NBR, because it is a reliable method for fire-mapping and change detection.
Garcia-Haro, Gilabert, and Melia compared NDVI, Multitemporal Principal Component Analysis (MPCA), and Vector Change Analysis (CVA) to identify which method would be best for burn area mapping (2001). The authors discovered that NDVI was the most reliable method to map a burn area, because it emphasizes the vegetation loss and regeneration post-fire. Since dNDVI focuses on vegetation loss or recovery, it was used this project to see how post-fire vegetation regeneration was affected by the changes in slope or precipitation.
Moradizadeh et al determined the effects of burn severity on post-fire plant regeneration and diversity (2020). Environmental conditions, such as topography and vegetation type, were consistent throughout their 120 samples and made the only changing factor across the burn area burn severity. Isolating burn severity as the one changing variable is ideal, because post-fire regeneration has been found to be linked to environmental factors including soil type, vegetation type, and fire history (Peterson & Stow, 2003). The low slope and high slope regions of my project were taken to have similar areas, precipitation, and burn severity to gage how differences in slope changed regeneration.
This research will provide insight as to how recent and future California wildfires will recover based on the slope and precipitation received by an area. The results of this study will be used to predict which areas of a large burn area will successfully recover or struggle to recover.
Research
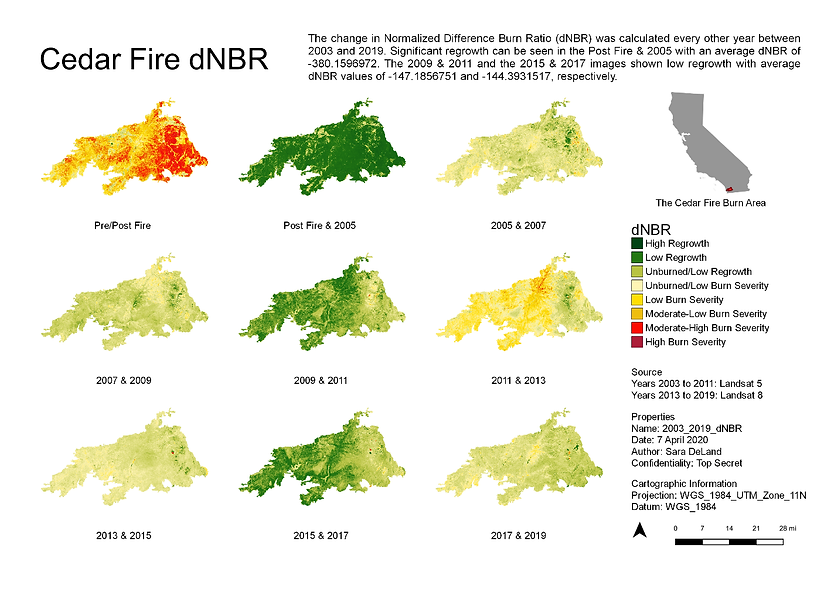
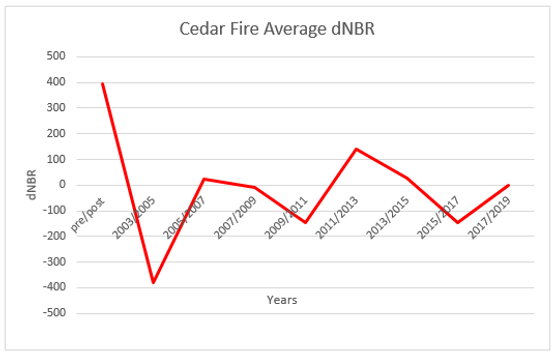
The Cedar Fire dNBR shows that the burn area experienced low to high burn severity after the fire in the Pre/Post Fire image. The average dNBR for the burn area for the Pre/Post Fire image was moderate-low severity at 395 as shown in the Cedar Fire Average dNBR Graph 1. The Post Fire & 2005 image shows that significant post-fire regrowth occurred in the years after the fire as the average dNBR for the burn area was -380. The 2009 & 2011 and 2015 & 2017 dNBR images are also successful regrowth years with an average dNBR of -147 and -144, respectively.
The 2011 & 2013 image shows that there are areas that experienced moderate-high burns in the north and moderate-low burns in the west and central regions. This results in an average low dNBR of 139, suggesting that some of the burn area experienced fires during this time. There is also a reoccurring area that experiences a high to moderate-high burn severity in the years 2009 & 2011, 2013 & 2015, and 2015 & 2017. Reoccurring fires in these years could be affecting the area shown in red in all three of these years in the eastern region of the burn area.
Research
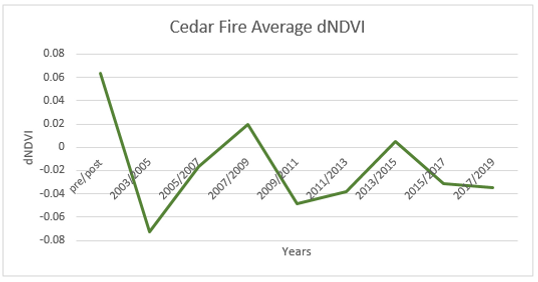
The Cedar Fire dNDVI shows that there was medium to medium-high vegetation loss after the fire in the Pre/Post Fire image. Regrowth occurs in the Post Fire & 2005, 2009 & 2011, 2011 & 2013, and 2015 & 2017 images with the average dNDVI being -0.073, -0.049, -0.038, and -0.031, respectively.

Research
The Cedar Fire Burn Area Precipitation shows that the Post Fire & 2005, 2009 & 2011, and 2015 & 2017 images received the most rainfall with sums of 33, 36, and 34 inches, respectively. 2007 & 2009 and 2017 & 2019 received 25 inches of rain each. 2005 & 2007, 2011 & 2013, and 2013 & 2015 saw the least amount of precipitation of 15, 17, and 15 inches, respectively.
The years with the lowest dNBR values, Post Fire & 2005, 2009 & 2011, and 2015 & 2017, are also the years with the most precipitation. The dNDVI values also reflect regeneration in those years along with the dNBR values. Graphs showing the dNBR, dNDVI, and total precipitation show a negative correlation between the regeneration the burn area and the precipitation that the area received. Higher amounts of rainfall led to lower dNBR and dNDVI values and more regrowth.


Research
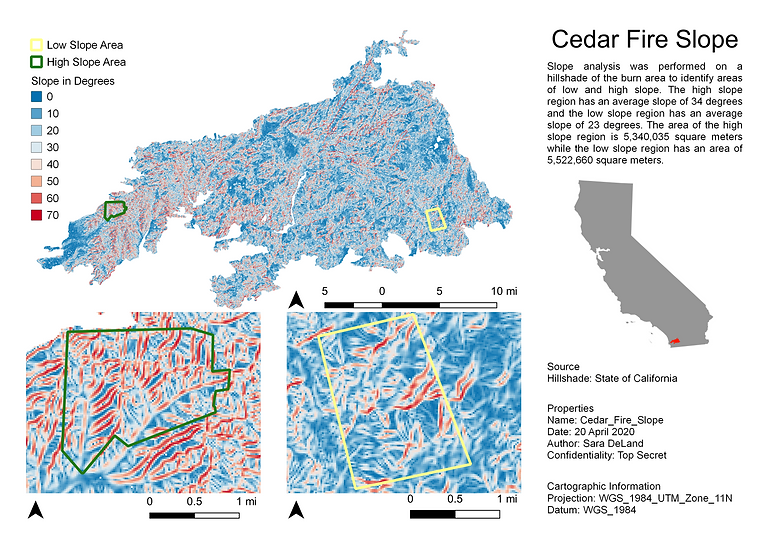
The Cedar Fire Slope was used to identify similar areas with different average slopes. The high slope area has an average slope of 34 degrees and the low slope area has an average slope has 23 degrees. While the average slopes of the regions are different, they have similar areas, total precipitations, and post fire dNBR values to focus on differences in slope. The low slope has an area of 5,522,660 square meters while the high slope has an area of 5,340,035 square meters.
The Post Fire & 2005, 2009 & 2011, and 2015 & 2017 images were studied for the low and high slope regions since they showed the most regeneration for the entire burn area. The average dNBR value for the Pre/Post Fire images was 715 for the low slope region and 511 for the high slope region. The total precipitation received by the low and high slope regions were within an inch of each other for each of the years of interest.

Research
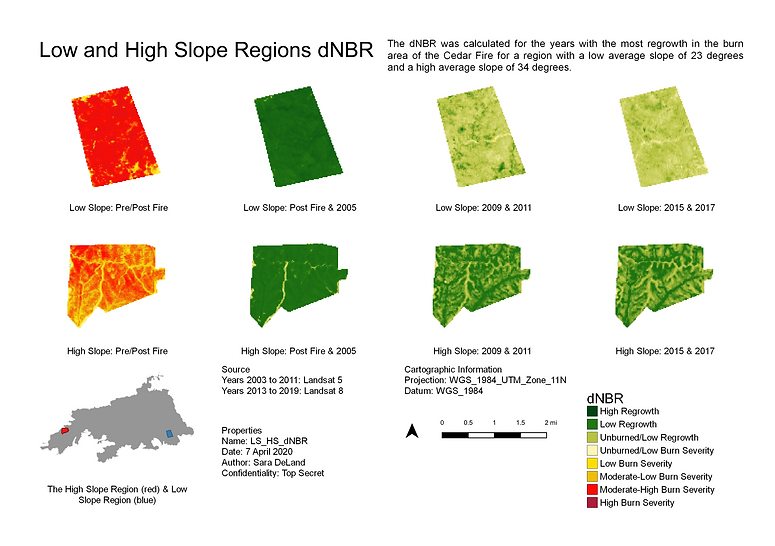
The Low and High Slope Regions dNBR compares the burn severity of the two regions during the years that the entire burn area showed significant regeneration. The Average dNBR Graph 4 shows that the low slope region had a higher initial burn severity and experienced more regrowth in the Post-Fire & 2005 time-frame, the region experiences little to no regrowth in 2009 & 2011 and 2015 & 2017. In contrast, the high slope region experiences low and high post-fire regrowth in all three of the time frames.

Research
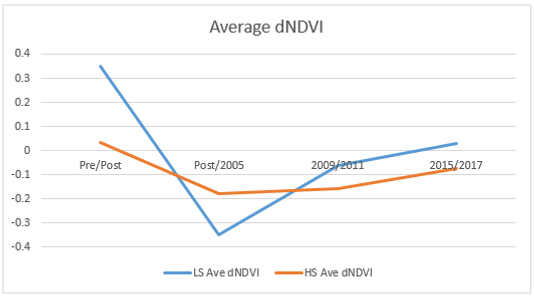
The Low and High Slope Regions dNDVI compares the vegetation regrowth of the two regions during the years that the entire burn area showed significant regeneration. The dNDVI values differed greatly with the low slope region value being 0.350 and the high slope value being 0.036. This difference could indicate that there was more initial vegetation in the low slope region than in the high slope region. The Average dNDVI Graph 5 shows that the low slope region had a higher initial vegetation loss and experienced more regrowth in the Post-Fire & 2005 timeframe, but the region experiences little to no vegetation regrowth in 2009 & 2011 and 2015 & 2017. In contrast, the high slope region experiences low and high post-fire regrowth in all three of the time frames.
Like the dNBR and dNDVI for the overall burn area, these variables have a positive correlation in the high and low slope regions. The total average precipitation received by the two regions were within an inch of each other for each dNBR and dNDVI image. Since the precipitation each region received is similar, it is possible that the difference in slopes could have impacted the way that each region recovered.

Methodologies
The raster data collected by the Landsat 5 Thematic Mapper (TM) and Landsat 8 Operational Land Imager (OLI) and Thermal Infrared Sensor (TIRS) satellites was used to create the Normalized Difference Vegetation Index and the Normalized Burn Index images in QGIS. First, each band was preprocessed using the Semi-Automatic Classification Plugin to perform Dark Object Subtraction (DOS) atmospheric correction to improve the images as done by Rogan et al (2001). DOS correction assumes that the darkest pixel in each band should be black and subtracts that value from the rest of the pixels in the band to reduce haze (Rogan et al, 2001).
After correcting the bands of each image, the NBR and NDVI rasters were created for odd years between 2003 and 2019. The corrected near-infrared (NIR) band, band 4 for Landsat 5 and band 5 for Landsat 8, and red band, band 3 for Landsat 5 and band 4 for Landsat 8, was used to create the NDVI images. The corrected short-wave infrared (SWIR) band, band 7 for Landsat 5 and 8, and NIR band was used to create the NBR images. The difference in NBR (dNBR) and difference in NDVI (dNDVI) were then created to determine the burn severity and vegetation regrowth between years, respectively.
Global monthly summaries containing the total precipitation received monthly between years at collected by the Weather Bureau Army Navy stations around the burn area were used into interpolate precipitation values within the burn area. Inverse Distance Weighting (IDW) was used in this case, because this technique assumes that things that are close together are similar and that the extremes of the data are already measured. There were only 11 stations that provided at least 85% coverage over the time periods of interest. The global monthly summaries were added together to provide the total amount of precipitation the weather stations received in inches.
Once these images were created, the Cedar Fire burn area shapefile was used to extract the burn area from the raster images. The burn area shapefile was created by the U.S. Geological Survey and USDA Forest Service in 2019 and contains burn areas from 1984 to 2017 across the United States. The Raster Statistics tool was then used to determine the average dNBR, dNDVI, and precipitation received by the burn area for each of the years and then plotted in Excel.
The hillshade of California was collected to analyze the topography and slope of the burn area. After clipping the hillshade using the burn area shapefile, the slope was calculated using the Slope tool in QGIS. Two shapefiles were then created to contain two areas with a high average slope and a low average slope that were both severely burned by the Cedar Fire and did not contain any other significant fires during the recovery process.
The region of interest determined as a low-slope area has an average slope of about 23 degrees and the high-slope area has an average slope of about 34 degrees. The standard deviations for both the low and the high slope areas are high, approximately 15 and 17 respectively. The high standard deviations suggest a wide variety of low slopes and high slopes in their respective regions of interest. These regions also have similar areas; the low slope has an area of 5,522,660 square meters while the high slope has an area of 5,340,035 square meters.
The low and high slope shapefiles were used to extract the dNBR, dNDVI, and precipitation interpolation data for the post-fire and 2005, 2009 and 2011, and 2015 and 2017 rasters. Since the overall burn area had the most regrowth in these years, the data for the low and high slope areas can be used to compare each regions’ regeneration success. Raster layer statistics was used once again to determine each regions’ average dNBR, dNDVI, and precipitation for the areas and graphed.


Conclusion
This project explored how precipitation and topography affected the 2003 Cedar Fire’s regrowth by analyzing the dNBR and dNDVI every other year from 2003 to 2019. The most vegetation loss and highest burn severity was observed immediately after the Cedar Fire in the Pre/Post Fire dNBR and dNDVI images. The most regrowth was seen in the years that received the most precipitation in the images Post Fire & 2005, 2009 & 2011, and 2015 & 2017. The average dNBR, average dNDVI, and total precipitation for the overall burn area shows that higher amounts of precipitation could lead to more regrowth.
The while the low and high slope regions had similar areas and total precipitation, there were differences in initial burn severity and vegetation loss. The dNBR values were similar in both regions, but the initial dNDVI values differed greatly between the two areas. Since the cause of the difference in initial dNDVI is unknown, it cannot be concluded that the slope was the only factor contributing to the different regrowth rates between the regions. Further analysis of regions with high or low average slopes and other similar or the same environmental variables would have to be conducted to see if the topography affects regrowth.
Similar research should be conducted on other burn areas with similar environmental factors to solidify a relationship between precipitation and slope with post-fire regrowth. This study could bring slope and precipitation to the attention of geoscientists to be further researched and start a conversation on how to address these environmental factors to government officials.
References
California Hillshade [Hillshade]. (2018). Retrieved from https://koordinates.com/layer/692-california-hillshade-30m/
Cardil, Adrián, Mola-Youdego, Blas, Blaszquez-Casado, Ángela, &González-Olabarria, José Ramón. (2019). Fire and burn severity assessment: Calibration of Relative Differenced Normalized Burn Ratio (RdNBR) with field data. Journal of Environmental Management, 235, 342-349. https://doi.org/10.1016/j.jenvman.2019.01.077
Garcia-Haro, FJ, Gilabert, MA, & Melia, J. (2001) Monitoring fire-affected areas using Thematic Mapper data. International Journal of Remote Sensing, 22(4), 533–549. DOI: 000167429400004.
Liu, Sicong, Zheng, Yongjie, Dalponte, Michele, Tong, Xiaohua & Du, Qian. (2019). Feature-Level Fusion of Landsat-8 OLI-SWIR and TIR Images for Fine Burned Area Change Detection. IGARSS 2019 - 2019 IEEE International Geoscience and Remote Sensing Symposium. 10.1109/IGARSS.2019.8900221
Moradizadeh, Hadieh, Heydari, Mehdi, Omidipour, Reza, Mezbani, Arash, & Prevosto, Bernard. (2020). Ecological effects of fire severity and time since fire on the diversity partitioning, composition and niche apportionment models of post-fire understory vegetation in semi-arid oak forests of Western Iran. Ecological Engineering, 143. https://doi.org/10.1016/j.ecoleng.2019.105694
National Oceanic and Atmospheric Association. (2020). Climate Data Online. Retrieved from https://www.ncdc.noaa.gov/cdo-web/
Peterson, S.H. & Stow, D.A. (2003). Using multiple image endmember spectral mixture analysis to study chaparral regrowth in southern California. International
Journal of Remote Sensing, 24(22), 4481-4504. https://doi-org.ezproxy.snhu.edu/10.1080/0143116031000082415
Rogan, John, Franklin, Janet, Stow, Doug, Levien, Lisa, & Fischer, Chris. (2001). Toward Operational Monitoring of Forest Cover Change in California Using Multitemporal Remote Sensing Data. IEEE 2001 International Geoscience and Remote Sensing Symposium, 7. DOI:10.1109/igarss.2001.978266
United States Department of Agriculture. (2019). MTBS Burn Area [Shapefile]. Retrieved from https://data.fs.usda.gov/geodata/edw/datasets.php?xmlKeyword=monitoring+trends+in+burn+severity
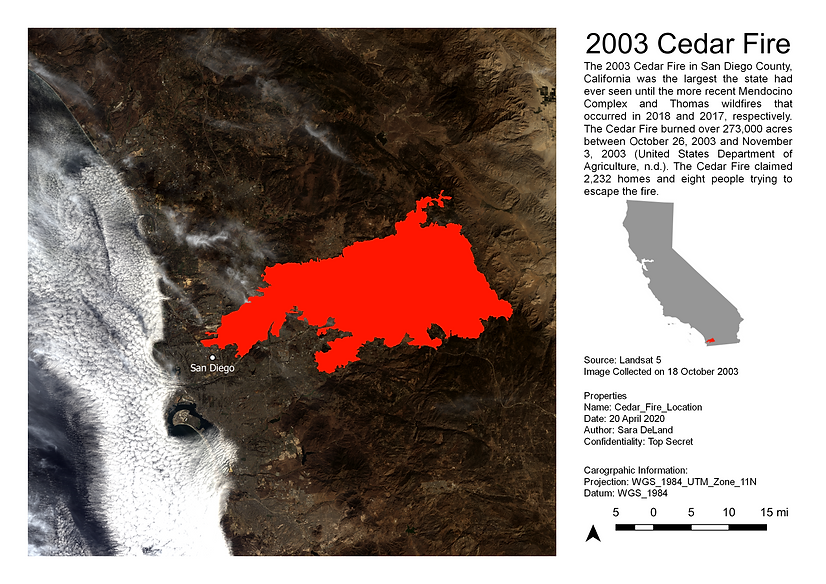
United States Department of Agriculture. (n.d.). The 2003 San Diego County Fire Siege Fire Safety Review [PDF File]. Retrieved from https://www.fs.usda.gov/Internet/FSE_DOCUMENTS/stelprdb5297020.pdf
USGS. (2004). The Normalized Burn Ratio (NBR) [PDF File]. Retrieved from https://burnseverity.cr.usgs.gov/pdfs/LAv4_BR_CheatSheet.pdf
USGS. (2020). GloVIS. Retrieved from https://glovis.usgs.gov